

Healthcare leaders are surrounded by data, but the challenge is knowing which numbers actually reveal financial risk before it reaches the bottom line.
A hospital or health system can have hundreds of thousands of dollars in delayed or at-risk revenue before Days in A/R materially increases. The earliest warning signs often appear upstream — in provider credentialing, payor enrollment, contracting, and unbilled claims processes.
By the time revenue cycle problems appear in traditional financial reports, the opportunity to prevent the impact has often already passed.
Many organizations track revenue cycle performance after a problem has already occurred — after claims have been denied, payments have slowed, or providers have lost valuable billing time.
But contracting and credentialing issues often create warning signs long before revenue is impacted.
A provider waiting months for credentialing. A payor reimbursement rate that no longer aligns with expectations. A growing percentage of claims denied due to enrollment issues.
These are not just administrative problems. They are financial risks.
For CFOs, COOs, and practice owners, understanding the right revenue cycle KPIs for credentialing and contracting can provide the visibility needed to identify problems early and protect cash flow.
Why Leadership Needs Visibility Into Credentialing and Contracting Data

Credentialing and payor contracting directly impact an organization’s ability to generate revenue.
A provider cannot bill certain payors until credentialing is complete. A contract that has not been properly reviewed can leave significant revenue on the table. A breakdown in communication between operations, billing, and payor management can result in preventable denials.
Yet many leadership teams only see the impact after the damage has been done.
Traditional financial reporting may show declining collections or increased denials, but it often does not answer the most important questions:
- Why is revenue being delayed?
- Which providers are unable to bill?
- Are payor contracts performing as expected?
- Are credentialing delays creating lost revenue opportunities?
- Where should leadership intervene?
The right dashboard turns these questions into measurable answers.
The Key Metrics Leadership Should Track
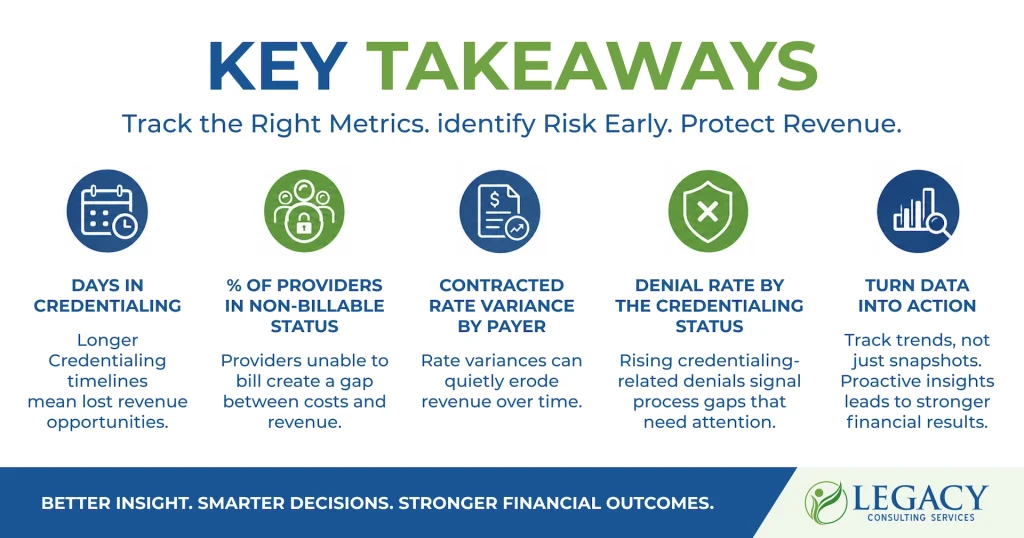
Days in Credentialing
What it measures:
The average number of days it takes a provider to move from credentialing submission to approval and billing readiness.
Why it matters financially:
Every day a provider remains unable to bill represents potential lost revenue.
Credentialing delays are especially costly when organizations have invested in recruiting new providers, expanding service lines, or increasing patient capacity. A provider who cannot participate with key payors is not operating at their full revenue potential.
Leadership should ask:
- How long are providers waiting before becoming billable?
- Are delays occurring with specific payors?
- Are credentialing timelines increasing over time?
Potential warning sign:
A rising average credentialing timeline or providers consistently exceeding expected payor turnaround times should trigger investigation.
Reducing unnecessary credentialing delays can help organizations accelerate provider productivity and improve revenue opportunities.
Percentage of Providers in Non-Billable Status
What it measures:
The percentage of providers who are actively employed or contracted but cannot fully generate revenue because credentialing, enrollment, or payor participation is incomplete.
Why it matters financially:
This metric connects directly to lost earning potential.
A provider on payroll who cannot see patients covered by certain payors creates a gap between operational costs and revenue generation.
Leadership should understand:
- How many providers are currently unable to bill?
- How long have they been in that status?
- Which payors or processes are creating the delay?
Potential warning sign:
Even a small percentage of non-billable providers can represent significant financial exposure depending on provider specialty, volume, and payor mix.
This metric helps leadership identify revenue opportunities that may currently be sitting idle.
Contracted Rate Variance by payor
What it measures:
The difference between expected reimbursement rates and actual contracted payor rates.
Why it matters financially:
Not all contracts perform equally.
Healthcare organizations may assume payor agreements are producing appropriate reimbursement, but outdated contracts, missed negotiation opportunities, or inconsistent payor terms can quietly reduce revenue.
Leadership should monitor:
- Are contracted rates keeping pace with costs?
- Are reimbursement rates consistent across similar services?
- Are certain payors consistently underperforming?
Potential warning sign:
Significant differences between expected and actual reimbursement should prompt a contract review.
Small rate variances multiplied across thousands of claims can create substantial annual revenue impact.
Denial Rate by Credentialing Status
What it measures:
The relationship between claim denials and provider credentialing or enrollment issues.
Why it matters financially:
Credentialing-related denials are often preventable.
When claims are denied because a provider is not properly credentialed, enrolled, or linked correctly with a payor, organizations lose valuable time correcting issues that should have been addressed upstream.
Leadership should review:
- Which denials are tied to credentialing issues?
- Are certain payors creating repeated enrollment problems?
- Are new providers generating higher denial rates?
Potential warning sign:
An increase in credentialing-related denials may indicate gaps in onboarding, payor enrollment processes, or internal communication.
What Threshold Should Trigger Executive Attention?
The value of reporting is not simply collecting data. It is knowing when the numbers require action.
Leadership dashboards should highlight trends, not just snapshots.
Metrics that deserve attention include:
- Credentialing timelines increasing month over month
- A growing percentage of providers unable to bill
- Reimbursement rates declining compared to expectations
- Increased denials connected to credentialing status
- Revenue delays tied to payor enrollment issues
The exact thresholds will vary based on organization size, specialty, payor mix, and operational goals.
However, the key question remains:
Is the organization identifying these issues before they impact revenue — or after?
Building Credentialing and Contracting Metrics Into Your Reporting Cadence

The most effective organizations do not review these metrics once a year during strategic planning. They build them into ongoing leadership conversations.
A strong reporting cadence may include:
Monthly leadership reviews
- Credentialing pipeline status
- Provider billable status
- Denial trends
- payor performance
Quarterly financial reviews
- Contract performance
- Reimbursement trends
- Revenue opportunities
- Process improvements
When contracting and credentialing data are connected to financial outcomes, leadership gains the visibility needed to make proactive decisions.
Identify Revenue Risks Before They Impact Your Bottom Line
The healthcare organizations that consistently outperform financially don’t wait until cash flow declines to investigate operational issues. They monitor the operational signals that predict revenue risk before it ever reaches the income statement.
With the right reporting and analytics in place, leadership can move from reacting to financial problems to preventing them.
Legacy Consulting Services helps healthcare organizations transform operational data into executive insight through credentialing analytics, payer contracting support, revenue cycle reporting, and strategic consulting.
If you’d like to uncover hidden revenue risks, strengthen your reporting, and build a more proactive revenue cycle strategy, schedule a consultation with Legacy Consulting Services today.
Frequently Asked Questions
What KPIs should healthcare leaders track for credentialing?
Healthcare leaders should monitor credentialing turnaround time, percentage of providers in non-billable status, credentialing-related denials, and payor enrollment performance. These metrics help identify delays that can impact provider productivity and revenue.
What metrics reveal payor contracting problems?
Contracted rate variance, reimbursement trends, payor performance comparisons, and changes in denial patterns can reveal potential contracting issues before they significantly impact revenue.
How do you measure revenue cycle health?
Revenue cycle health is measured by reviewing key financial and operational indicators, including days in accounts receivable, denial rates, reimbursement performance, provider productivity, and credentialing-related revenue delays.